
Today, on CEF Investors, we are going to review the Calamos Strategic Total Return Fund, ticker symbol CSQ. Is CSQ right for you? We can answer that question in just a few minutes. We are going to look at the funds purpose, ratings, performance, dividends, holdings and NAV. At the end of the video we will sum up what we have learned and give CSQ a grade in the top categories. If you like information about Closed-End Funds, then please consider liking and subscribing to our YouTube channel.
Disclaimer
But first the legal stuff. Make sure you read our disclaimer by clicking here before you make any financial decisions. Now, let’s get started.
Watch on YouTube
If you would like to watch this article on YouTube click below
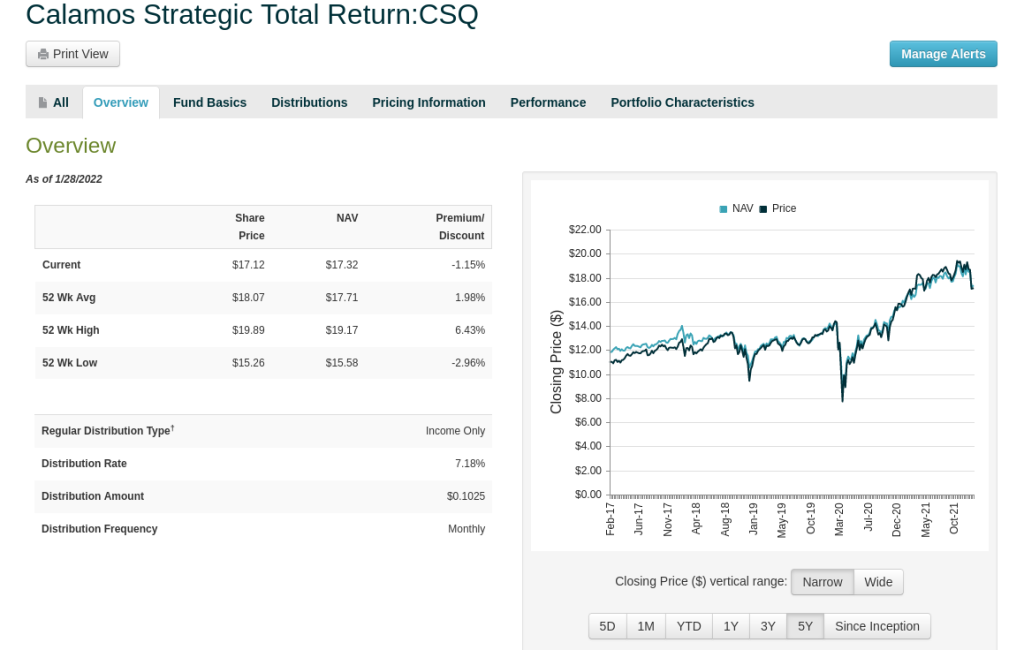
Overview
The Calamos Strategic Total Return Fund inception date was March 26, 2004. The Fund seeks total return through a combination of capital appreciation, and current income by investing in a diversified portfolio of equities, convertible securities and high-yield corporate bonds. The three key features of the fund are: number 1, it aims to provide consistent income, through monthly distributions set at levels the investment team believes are sustainable. Number 2, it offers a diversified approach, that includes at least 50% in equities, and seeks to manage risk by investing in convertibles and fixed-income securities, deemed beneficial during periods of high volatility. And number 3, it’s judicious use of leverage, seeks to enhance overall returns by achieving a positive spread, on investments over borrowing costs. This fund may be appropriate, for investors seeking an attractive monthly distribution, a long-term allocation to equities, and potentially lower volatility through active management.
https://www.calamos.com/funds/closed-end/strategic-total-return-csq/
Ratings
The first thing I like to check when researching a fund, is what do the experts say. Let’s hop over to Morningstar and get their rating.
Morningstar
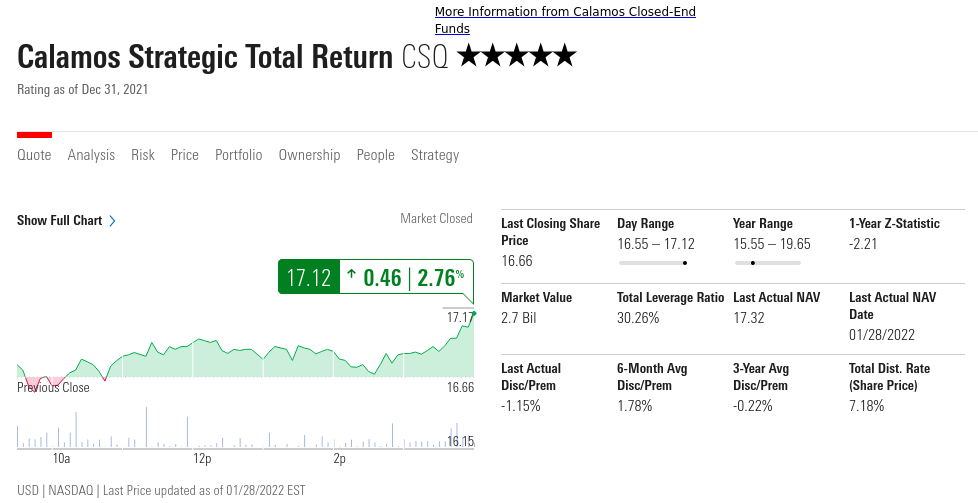
Morningstar assigns star ratings based on their analysts’ estimates of a stock’s fair value. A 5-star stock is a good value at its current price; a 1-star stock isn’t. Star ratings, which are updated daily, can change for three reasons: because analysts alter their estimate of a stock’s fair value, because a stock’s price changes, or both. Ratings that change because analysts alter their estimate of a stock’s fair value, are marked with the asterisk symbol. Morningstar has rated CSQ as five stars, so that’s excellent.
The Street
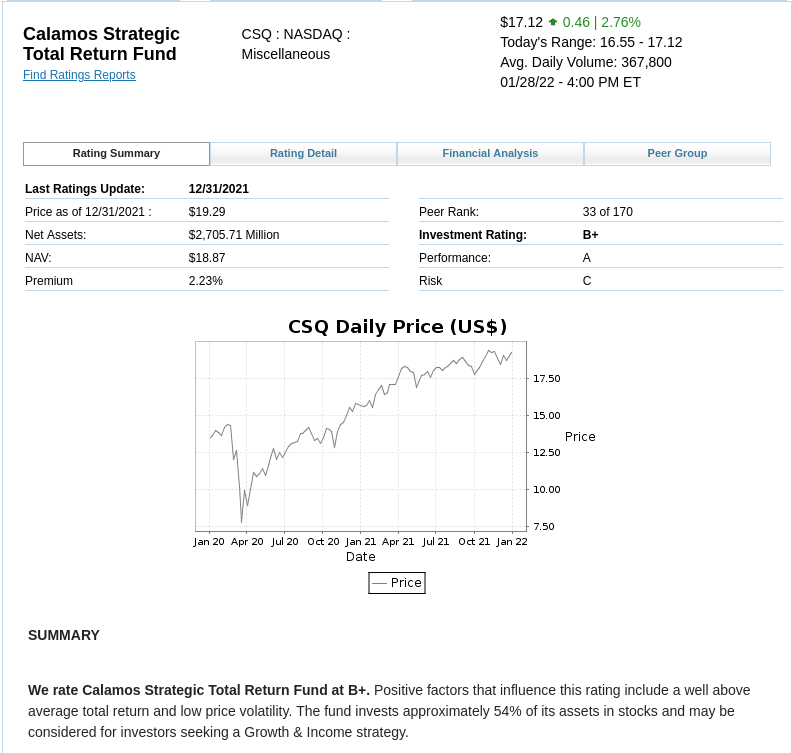
The next place I like to check out is The Street. On The Street’s website they say that, unlike many other rating agencies, they analyze both fundamental and technical risk factors. They use more rigorous standards for accuracy, to support their foundational belief, that a good investment should be able to perform well, regardless of the direction of the overall stock market.
The Street gives CSQ an investment rating of B+, a performance rating of A, and a risk rating of C. Positive factors that influence this rating include a well above average total return and low price volatility. The fund invests approximately 54% of its assets in stocks and may be considered for investors seeking a Growth & Income strategy.
Barchart
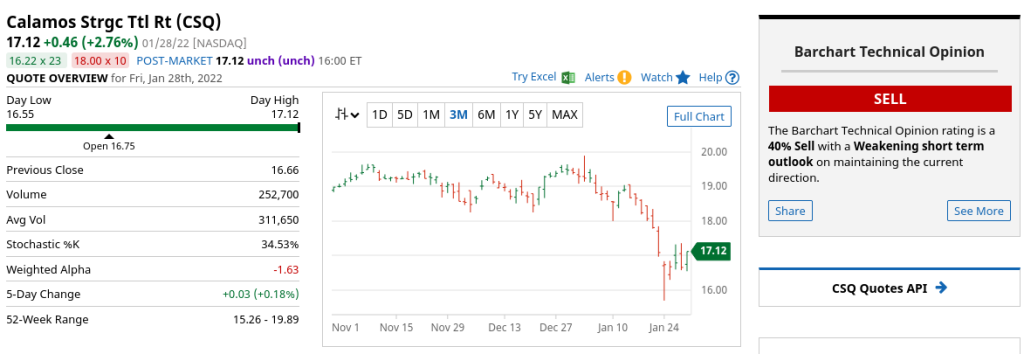
And last, let’s look at Bar Chart. Bar chart Opinions, show traders what a variety of popular trading systems are suggesting, in terms of going long or short the market. The Opinions takes up to 5 years’ worth of historical data, and runs these prices through thirteen different technical indicators. After each calculation, the program assigns a buy, sell, or hold value for each study, depending on where the price lies, in reference to the common interpretation of the study. Bar chart says that CSQ, is a Sell. The bar chart Technical Opinion rating is a 40% Sell with a Weakening short term outlook on maintaining the current direction.
Performance
Now lets check out this funds performance. Total return, takes both capital gains and dividends into account, in order to provide a complete picture, of how a stock performed over a specified time period. This can be extremely useful, for evaluating investment returns among dividend-paying stocks, and for comparing the performance, of dividend-paying stocks to those without any dividends, or other distributions.
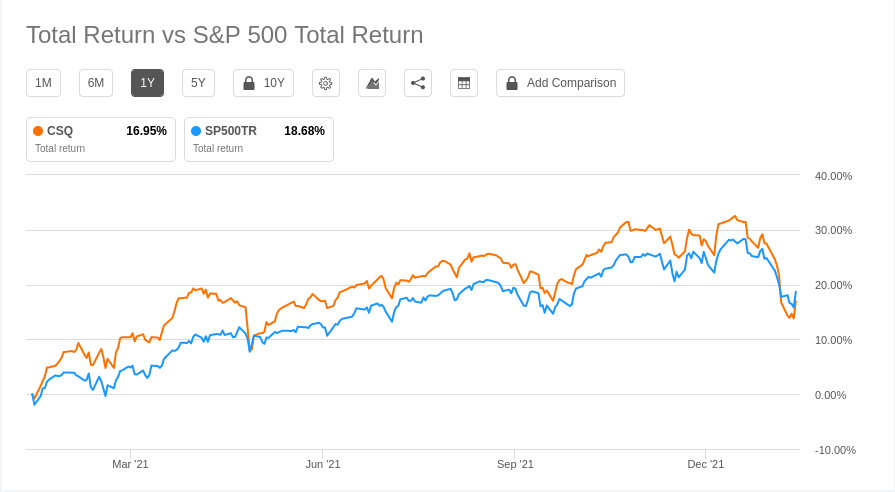
Total Return Performance
According to Seeking Alpha’s website, for the past year, the total return for CSQ, has generally out performed the total return of the S&P 500, by about 5%, which is excellent performance! Due to the current volatility of the markets, the total return is currently even with the S&P 500.
Price Performance
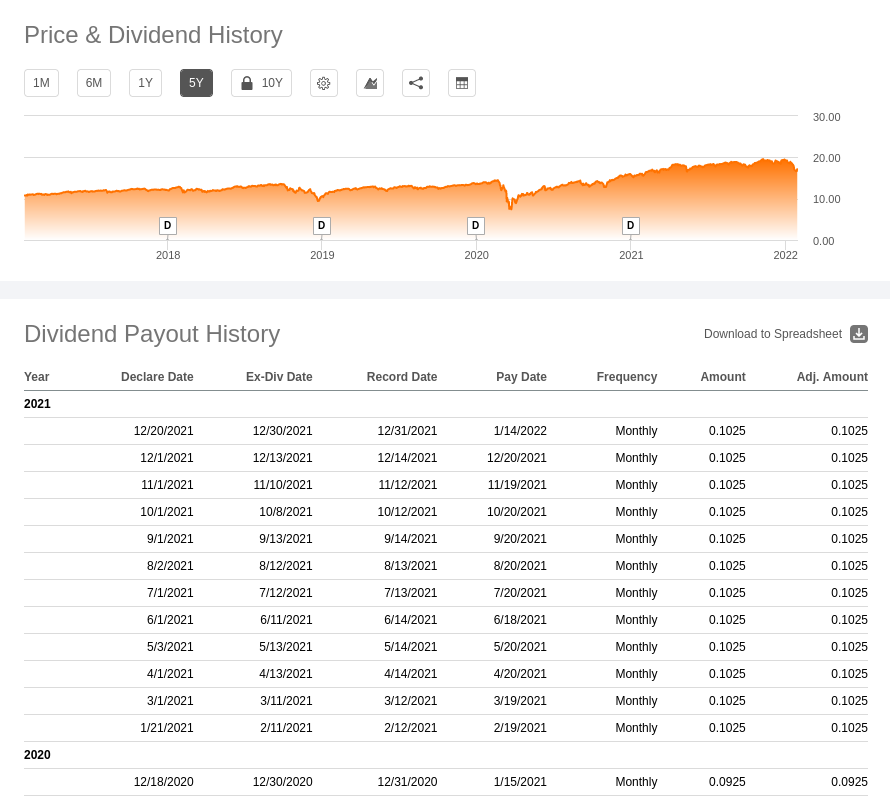
Seeking Alpha also shows, that the price of CSQ for the last five years, has had steady growth, starting around ten dollars and steadily increasing to the twenty dollar range.
Dividends
Continuing on, lets check out the dividends. Dividends are payments a company makes, to share profits with its stockholders. They are generally paid on a regular basis, usually monthly or quarterly, and they are one of the ways investors earn a return, from investing in stock.
Again, according to Seeking Alpha, the dividend yield currently is around 7%, which is good. Also, this fund has raised it’s dividend for the last two years, which is also an excellent sign. If we look at the historical yields, we can see that for the last five years, the yield has generally been between 6 and 10 percent.
All in all, for the last 5 years, this fund has had very stable price and yield.
Sectors
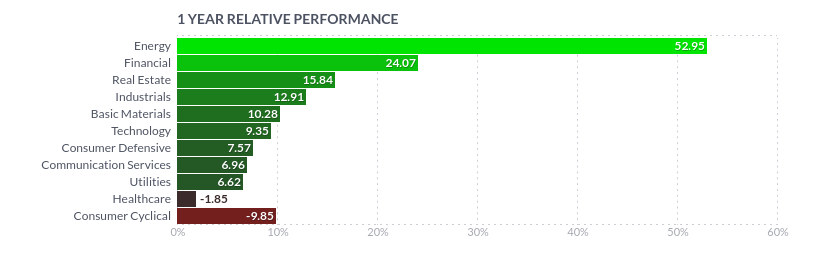
Before we look at the holdings of this fund, let’s find out what sectors are performing well. Comparing the sectors of our fund, to the sectors that are doing well, can give us valuable insight. Over at FinViz we can see, for the last year, that the top five sectors are Energy, Financial, Real Estate, Industrial and Basic Materials.
Holdings
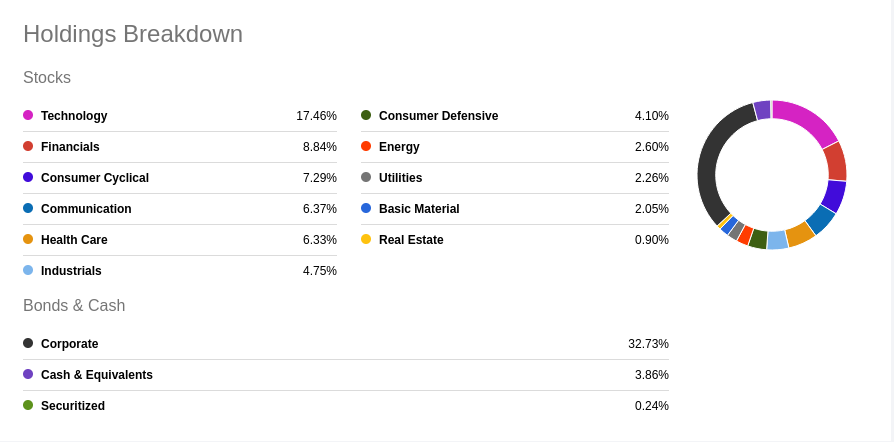
Now let’s see what holdings are in our fund. At Seeking Alpha, we can see that the top five sectors are Technology, Financial, Consumer Cyclical, Communication and Health Care. You can see that this fund is focused on one, of the top five performing sectors right now. The top 10 holdings, are all well know companies such as, Apple, Microsoft, Amazon, Alphabet, Nvidia, Meta, United Health, Bank of America, JP Morgan and Ford.
Net Asset Value (NAV)
What review of a closed-end fund would be complete, without a look at the NAV? Over at CEF Connect, we can see that for the last five years, this fund has traded fairly close to the NAV. So if you are the type of investor, that always wants to buy at discount, then there may be times when you can get this fund at discount.
Disclosure
And as full disclosure, I currently own 100 shares of CSQ, and will be looking to add more to my portfolio. This fund fits into my investment goals and strategy, as a solid performing, good paying dividend fund.
Conclusion
So is CSQ a buy for you? Let’s review what we have covered. We have two different sources giving CSQ a buy recommendation, and one giving a short term sell, so for long investors let’s give this fund a B for Ratings. For shorter term investors, let’s give the fund a D for Ratings. Since CSQ is out performing the S and P 500, we need to rate this fund as an A for performance. Any time a fund can pay steady dividends between 6 and 10 percent, you would need to give it an B for dividends. After reviewing the holdings, and the main investment sectors, CSQ should get a C for Holdings. You can see that CSQ definitely has some things going for it but, may have some drawbacks for some investors. Maybe CSQ can meet some of your investment goals and strategy.

Closing
Well, that raps up this article, thanks for reading. If you found this article helpful, please consider going to our YouTuble channel and liking, subscribing, and clicking the notification bell. Thanks, and we will see you next time.